Talks In Space Time

   
Recent changes
Table of contents
Links to this page
FRONT PAGE / INDEX

The problem ...

... with the Speaking Engagements map is that there are loads of talks in more-or-less the same place.

So here's an idea ...

Plot the locations of the talks on a map in the usual way, but let's also have another plot with time running across the diagram, and Latitude shown vertically.

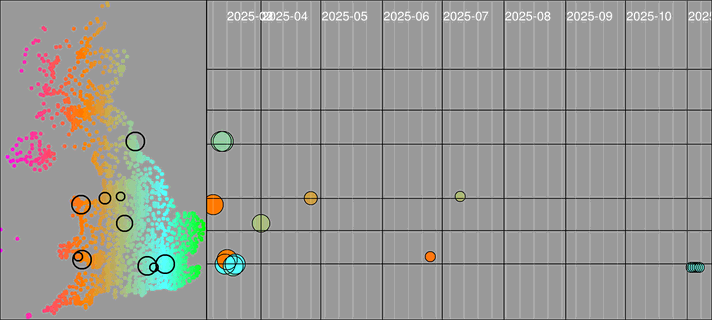
On the left is a map of the postcode districts of the UK. They're colour-coded according to how far West or East they are. Now we can colour-code each engagement according to how far East or West it is. On the main map we show them as green circles, larger means sooner. Then we smear them out according to when they are. Talks that are soon are at the left, talks that are some time away yet are at the right. The first of each month is marked with a vertical stripe. The colour of each talk is given by its postcode, and the vertical placement is its latitude. The horizontal lines are at the Latitudes of Aberdeen, Edinburgh, Newcastle, Liverpool, Birmingham, and London. If two blobs are the same colour and the same vertical placement, they're in the same place. If they are different colours you can use the map at left to find where they are.

https://www.solipsys.co.uk/new/images/talks_by_time.png

I've also marked Saturdays, which makes it easier to see which talks are more likely to be Master Classes, because they're on the weekends. So:
  • Do you find this diagram easy to understand?
  • What might you use this plot for?
  • Can you use it to find a talk near you?

Do you have any comments? Please LET US KNOW!

Contents


Links on this page

 
Site hosted by Colin and Rachel Wright:
  • Maths, Design, Juggling, Computing,
  • Embroidery, Proof-reading,
  • and other clever stuff.

Suggest a change ( <-- What does this mean?) / Send me email
Front Page / All pages by date / Site overview / Top of page

Universally Browser Friendly     Quotation from
Tim Berners-Lee
    Valid HTML 3.2!