More Detail About The Chart
|
|
AllPages RecentChanges Links to this page Edit this page Search Entry portal |
|
|
|
More Detail About The Chart |
|
||||
Explanation to follow ...
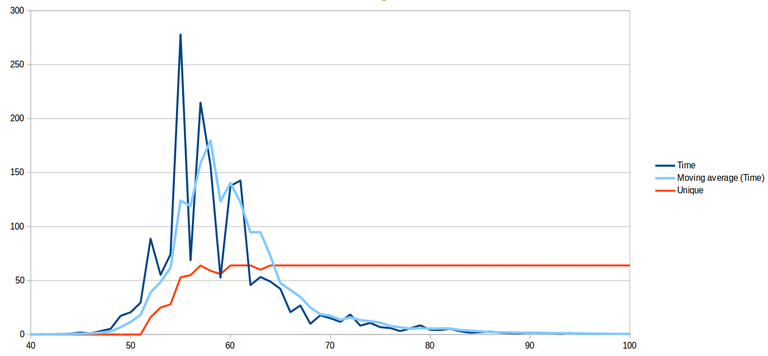
Raw data for $k=58$:
There are 8 graphs, each coloured 8 times with different random starting points.
| Graph #1 | 200.06:T | 150.25:T | 156.91:T | 128.18:T | 123.18:T | 192.33:T | 133.92:T | 180.54:T | All default |
| Graph #2 | 202.72:F | 189.61:T | 279.56:F | 145.47:T | 281.41:T | 115.88:F | 190.38:F | 327.05:F | Only 3 default |
| Graph #3 | 51.24:T | 72.19:T | 56.37:T | 69.34:T | 68.26:T | 68.82:T | 54.61:T | 83.06:T | All default |
| Graph #4 | 307.18:T | 311.09:T | 383.70:T | 253.17:T | 268.85:T | 279.24:T | 264.36:T | 338.95:T | All default |
| Graph #5 | 127.93:T | 80.92:T | 133.83:T | 83.47:T | 124.46:T | 116.96:T | 126.38:T | 83.61:T | All default |
| Graph #6 | 170.21:T | 179.85:T | 203.10:T | 218.25:T | 204.60:T | 211.18:T | 196.49:T | 217.63:T | All default |
| Graph #7 | 69.78:T | 2.65:T | 89.51:T | 82.87:T | 69.36:T | 83.72:T | 79.13:T | 94.63:T | All default |
| Graph #8 | 142.98:T | 140.36:T | 119.62:T | 130.24:T | 122.79:T | 146.04:T | 108.83:T | 138.92:T | All default |
You can see that graph #2 has non-default colourings (marked with "F") found, so it is not uniquely colourable.
For all the other graphs only the default colouring (marked "T") was found in the 8 attempts, so it's plausible (but not guaranteed) that those graphs are uniquely colourable.
The red line is the sum of how many times the default colouring was found. In this case it's 59 of the maximum possible 64.
In general, each row shows similar numbers for the time taken to colour the graph. There's one marked that shows a "lucky" colouring, taking much less time than the others in that row.