| All points |
DTV | 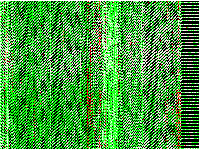 |
 |
 |
DTV |
| DVT | 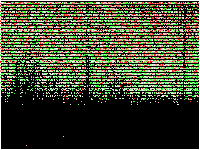 |
 |
 |
DVT | |
| TVD |  |
 |
 |
TVD | |
| Friday | DTV | 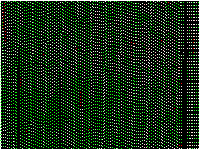 |
 |
 |
DTV |
| DVT | 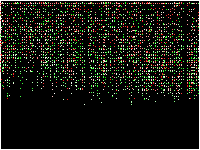 |
 |
 |
DVT | |
| TVD | 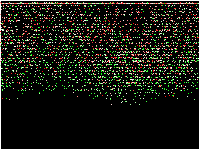 |
 |
 |
TVD | |
| Mid-week | DTV | 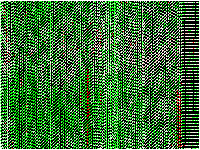 |
 |
 |
DTV |
| DVT |  |
 |
 |
DVT | |
| TVD |  |
 |
 |
TVD | |
| Weekend | DTV | 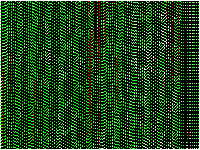 |
 |
 |
DTV |
| DVT | 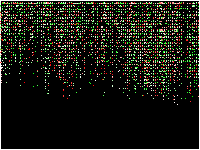 |
 |
 |
DVT | |
| TVD | 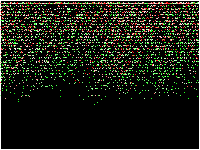 |
 |
 |
TVD | |
Point on the "newest" page on HN
A couple of months ago I did some analysis of the submission rates to Hacker News and looked at when it was best to submit items to have them on the "newest" page for the longest. In the discussion several useful points were made, but the thing that struck me was that if no one is looking at the page, it doesn't matter how long your item is there. Clearly you want a time when there are few submissions, but lots of views. That gives your item the best chance of getting seen and voted up.Well, without access to the server that's pretty hard to assess, so I wondered whether there was anything else that I could do. It did strike me that if items are getting upvotes, then that would show that they're getting viewed, and with enough data the extreme randomness of items and interests of viewers should more-or-less cancel out.
So I thought I'd measure the total number of points of the 30 items on the "newest" page. It's a pretty poor indication, but if it shows something then we can try to interpret it. If, on the other hand, it seems to show nothing, then we need to think again.
So here is the analysis. You might be advised to read the original first (opens in a new window) to get a sense of what sorts of patterns we might find, and how to interpret them.
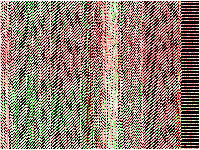
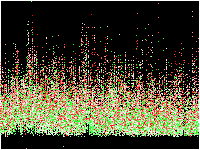
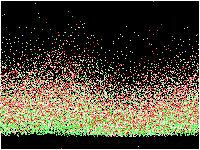
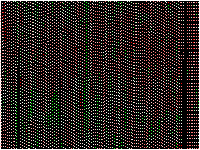
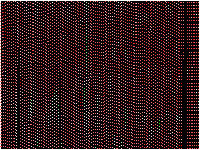
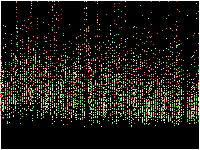
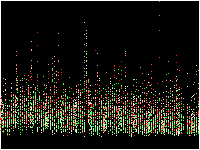
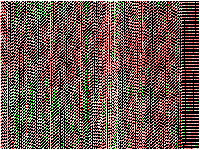
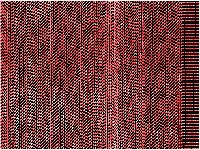
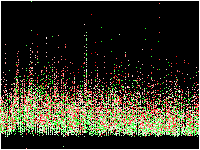
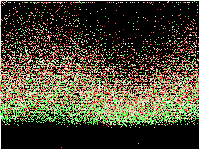
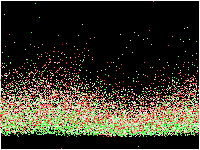
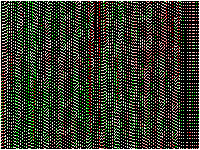
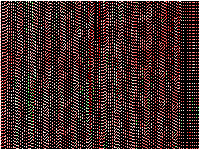
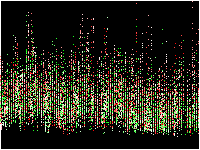
In the analysis here once again we have a scatter plot of 3D data. We show two dimensions in the obvious way, and the third dimension as a point in the following spectrum:
 |
(Don't give me grief over the choice of colours!)
The dimensions I have are Day, Time of day (in seconds) and the total number of points. The labels at the two sides of each row (DTV, DVT and TVD) show the X, Y and colour directions. Thus in the row DTV the horizontal axis is days, the vertical axis is time-of-day, and the colour is the number of points on the page.
The data run from February 2009 to February 2011, the time-of-day runs from 0 to 86399 seconds (of course), and the total number of points maxed out at 348.
The right hand column shows the full data set, but to get better discrimination I also show what happens if the points total is capped at 100 (left column) and 200 (centre column).
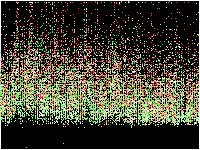
Conclusion
There's nothing to see - move along ...No, seriously, there doesn't seem to be any large scale structure to the data. At least, none that I can see.
So basically it appears that no matter what time of day, or when over the past two years, or whether it was a weekday, weekend, Friday, or whatever, the total number of points on the "newest" page of Hacker News is pretty much completely random.
Back to the drawing board ...